Dividend Tracker Spreadsheet, Portfolio, Passive Income, Yield on Cost, Monthly Calendar, Dividend Income, Excel Google Sheets
$3.99 USD
Buy on EtsyInstant digital download for Microsoft Excel and Google Sheets. Checkout and delivery are handled securely by Etsy.
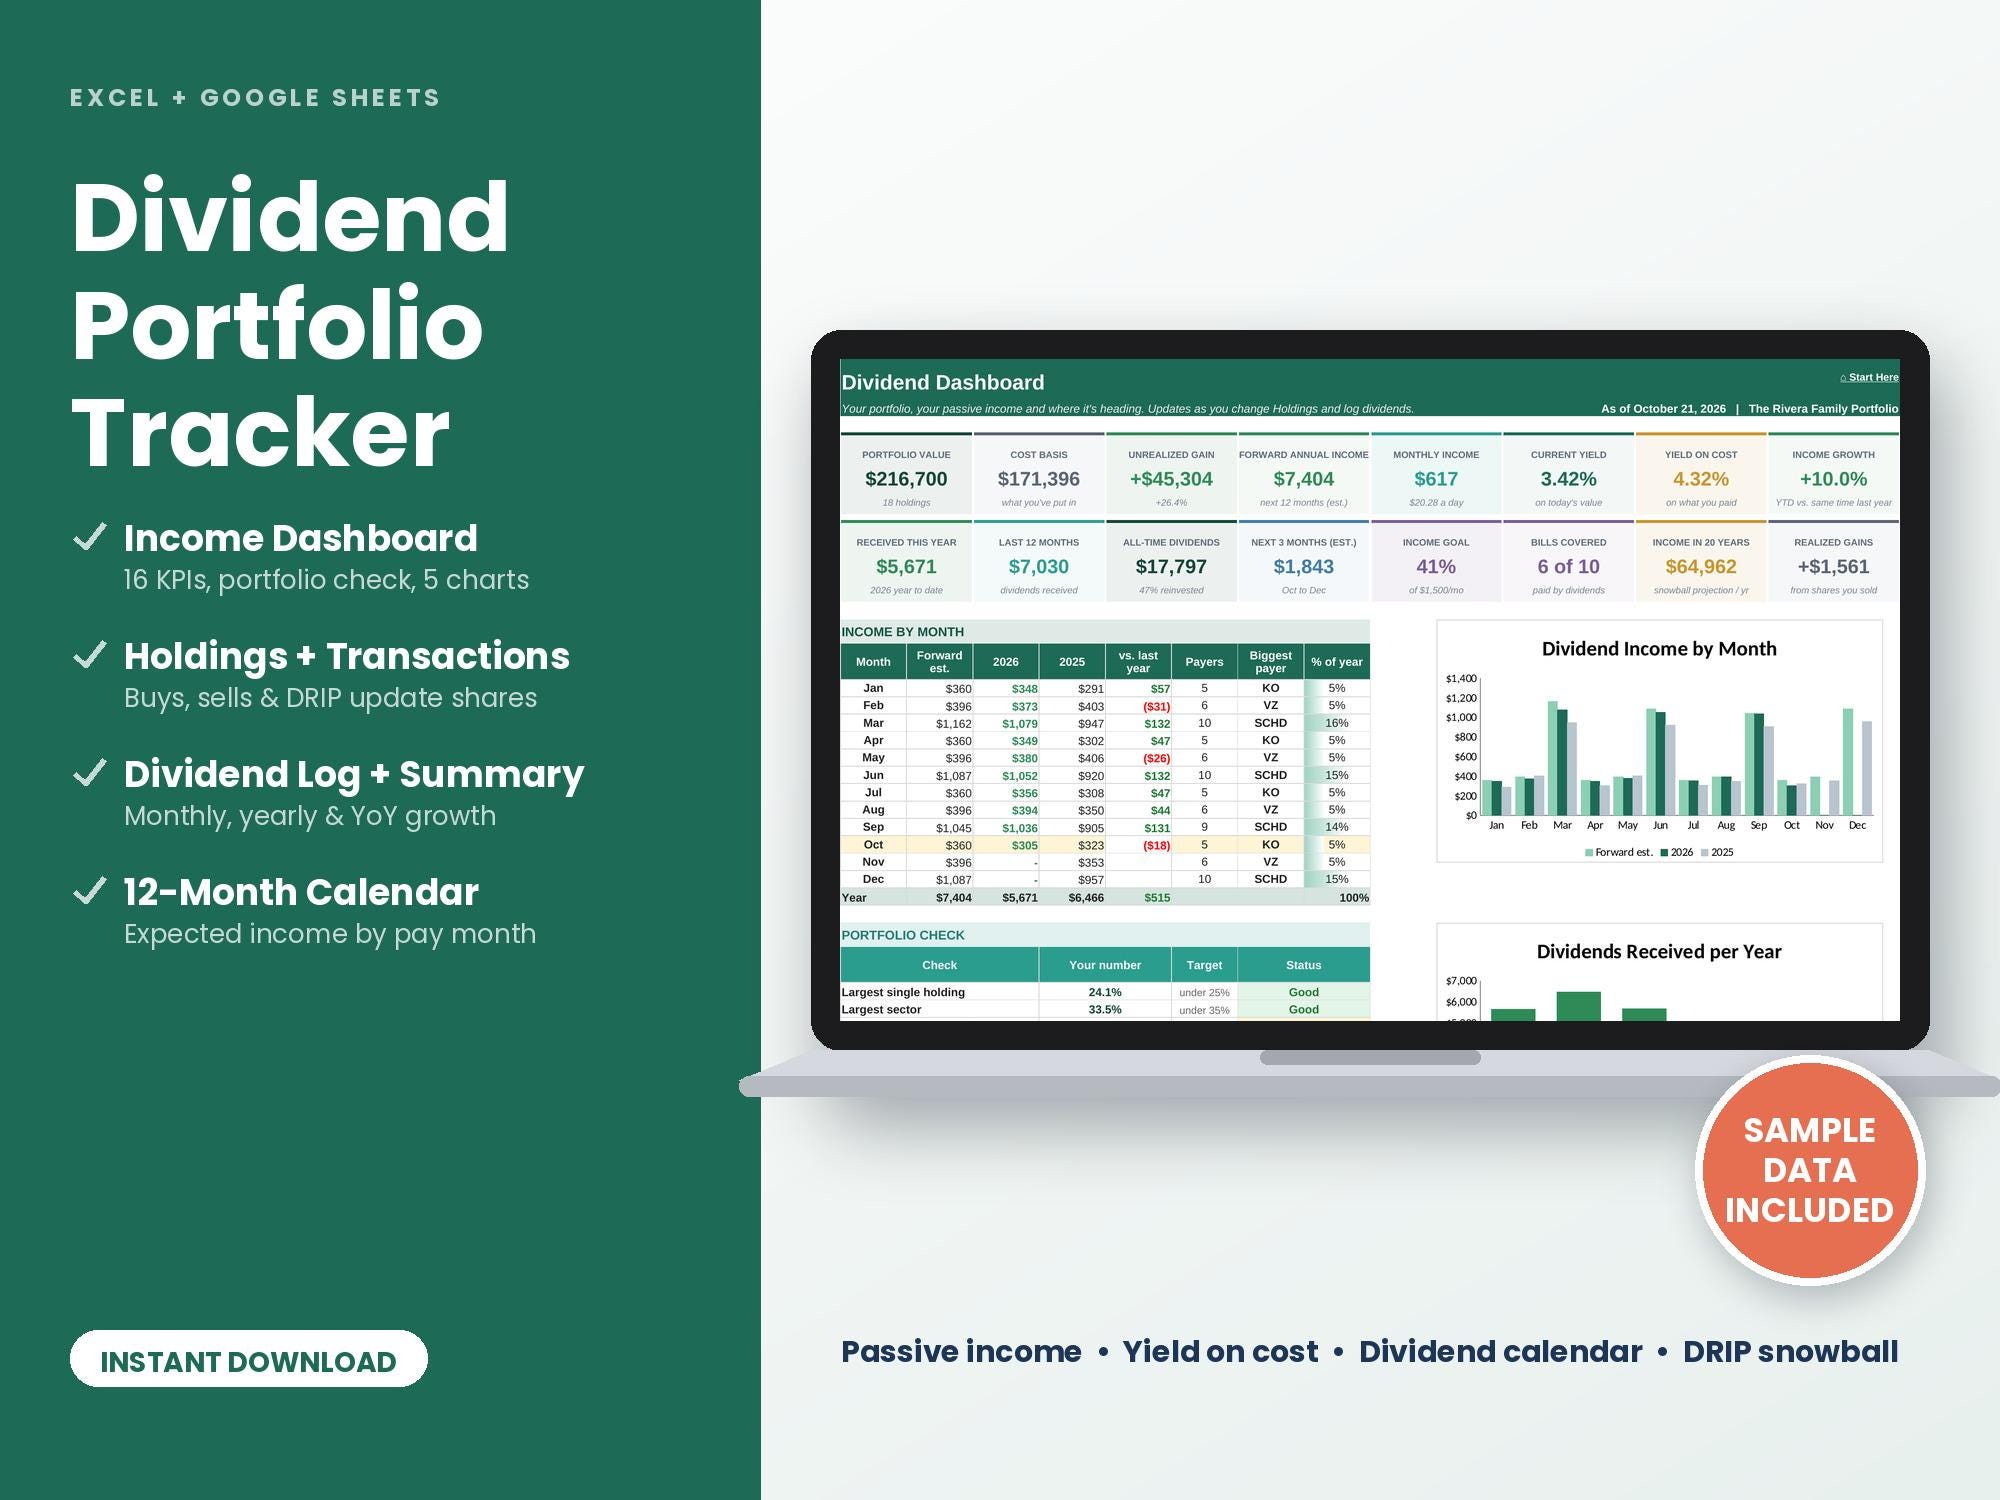
Dividend Tracker Spreadsheet for Microsoft Excel and Google Sheets, instant digital download. Track your dividend portfolio and passive income in one place. Enter your holdings once and see your annual income, yield, yield on cost and exactly which months your dividends arrive.
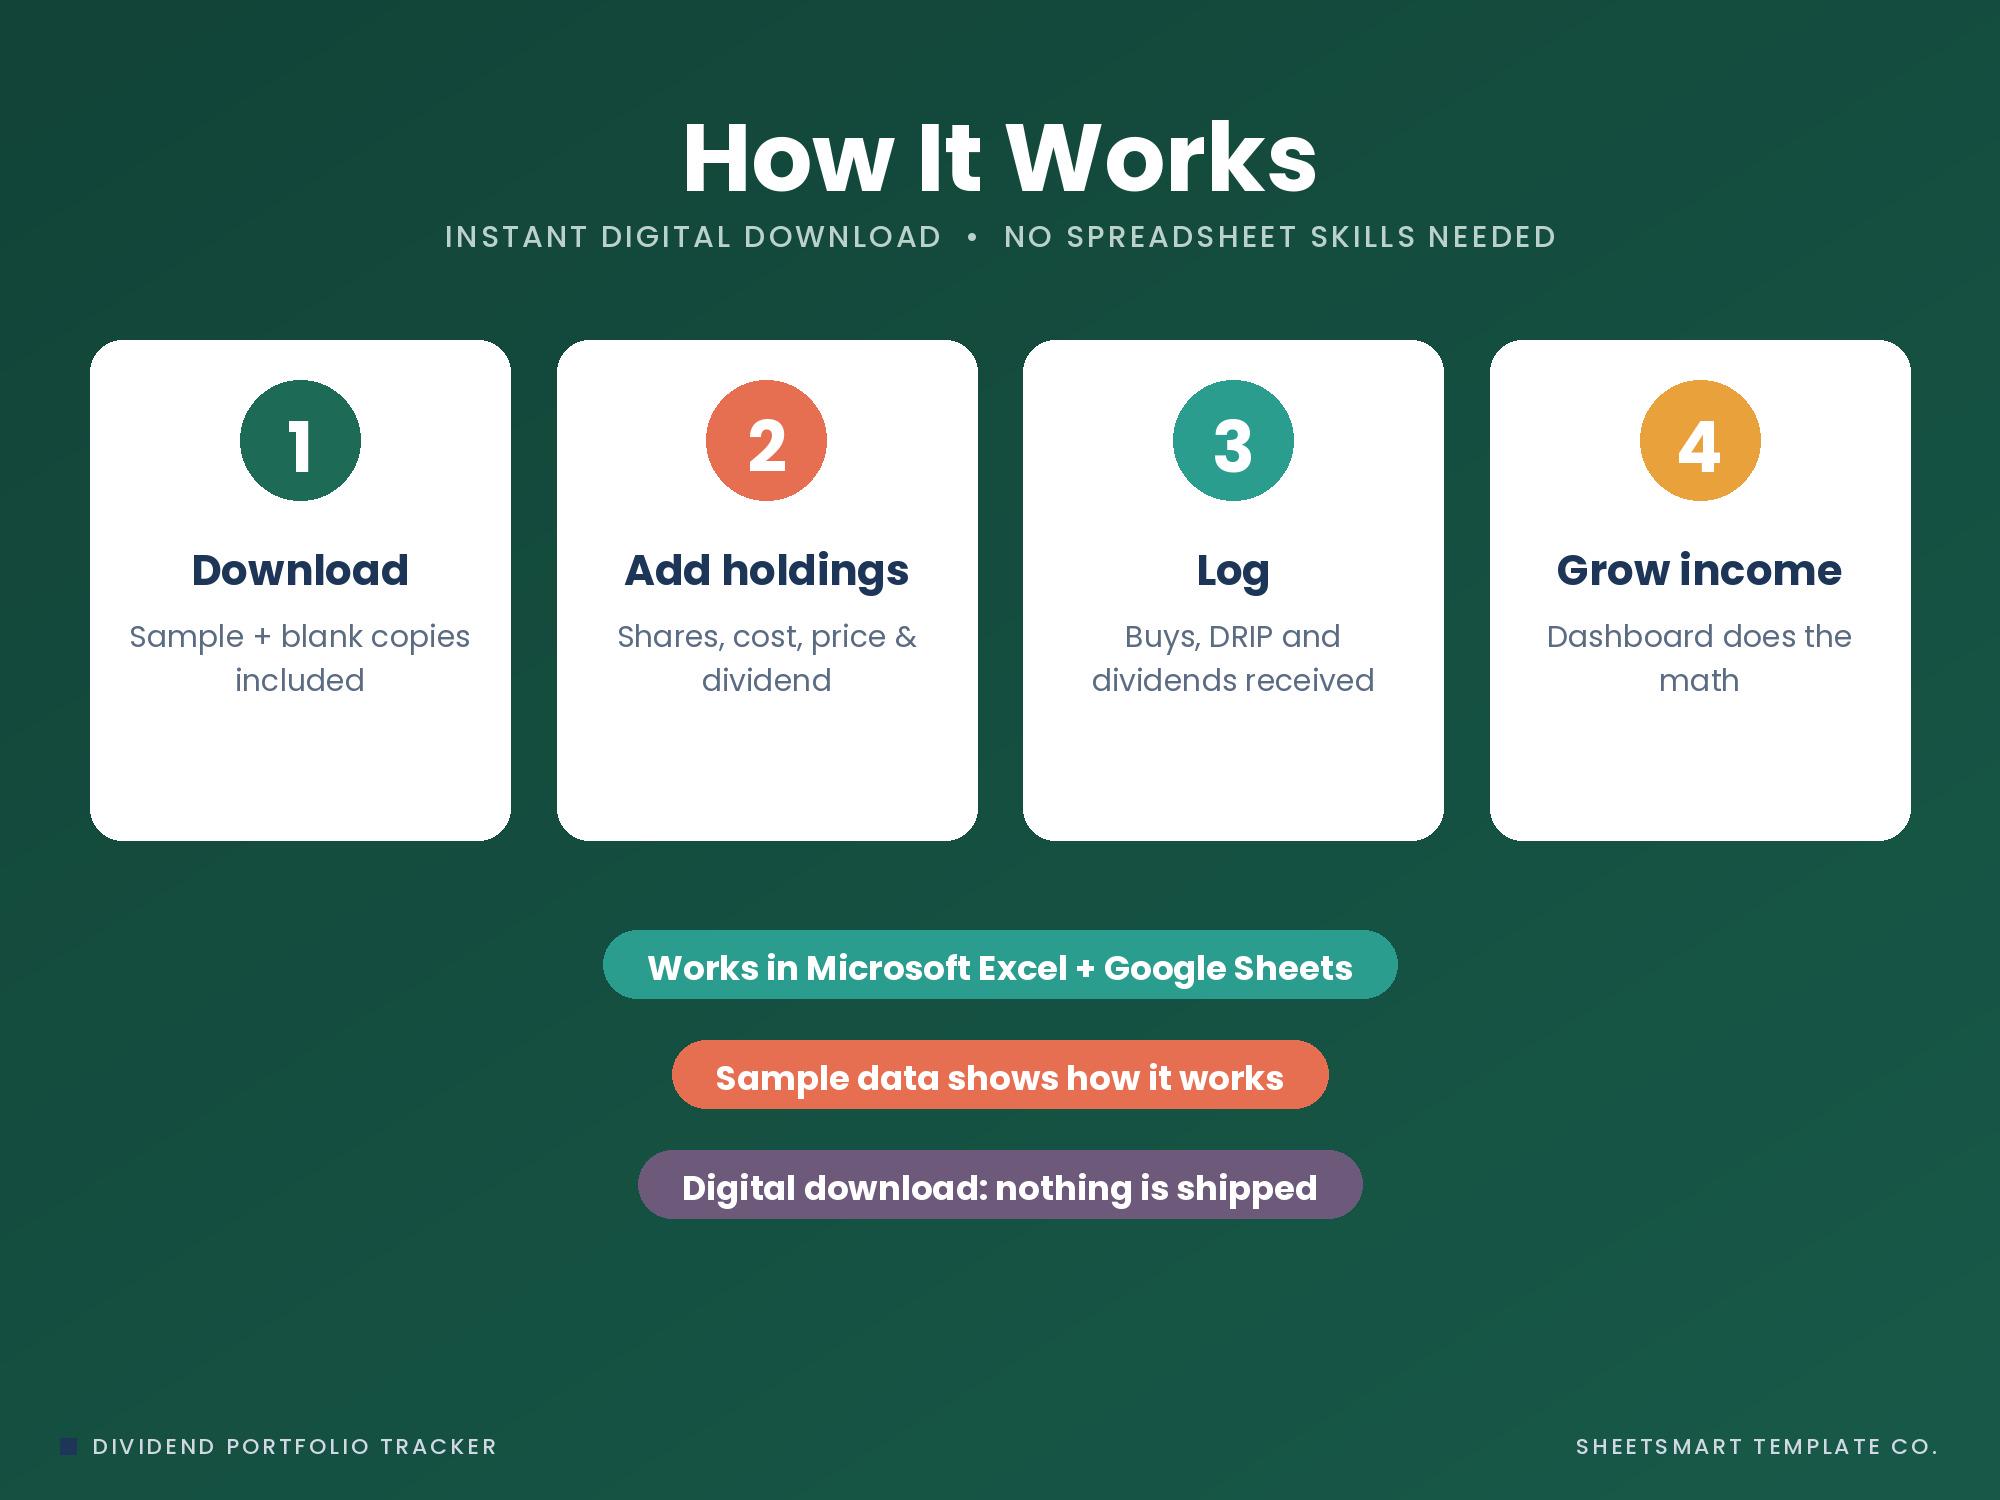
✨ NOW INCLUDES 4 FILES: a SAMPLE version (filled in so you can see exactly how it works) and a BLANK version (cleared and ready for your own info), each in an Excel edition and a Google Sheets edition.
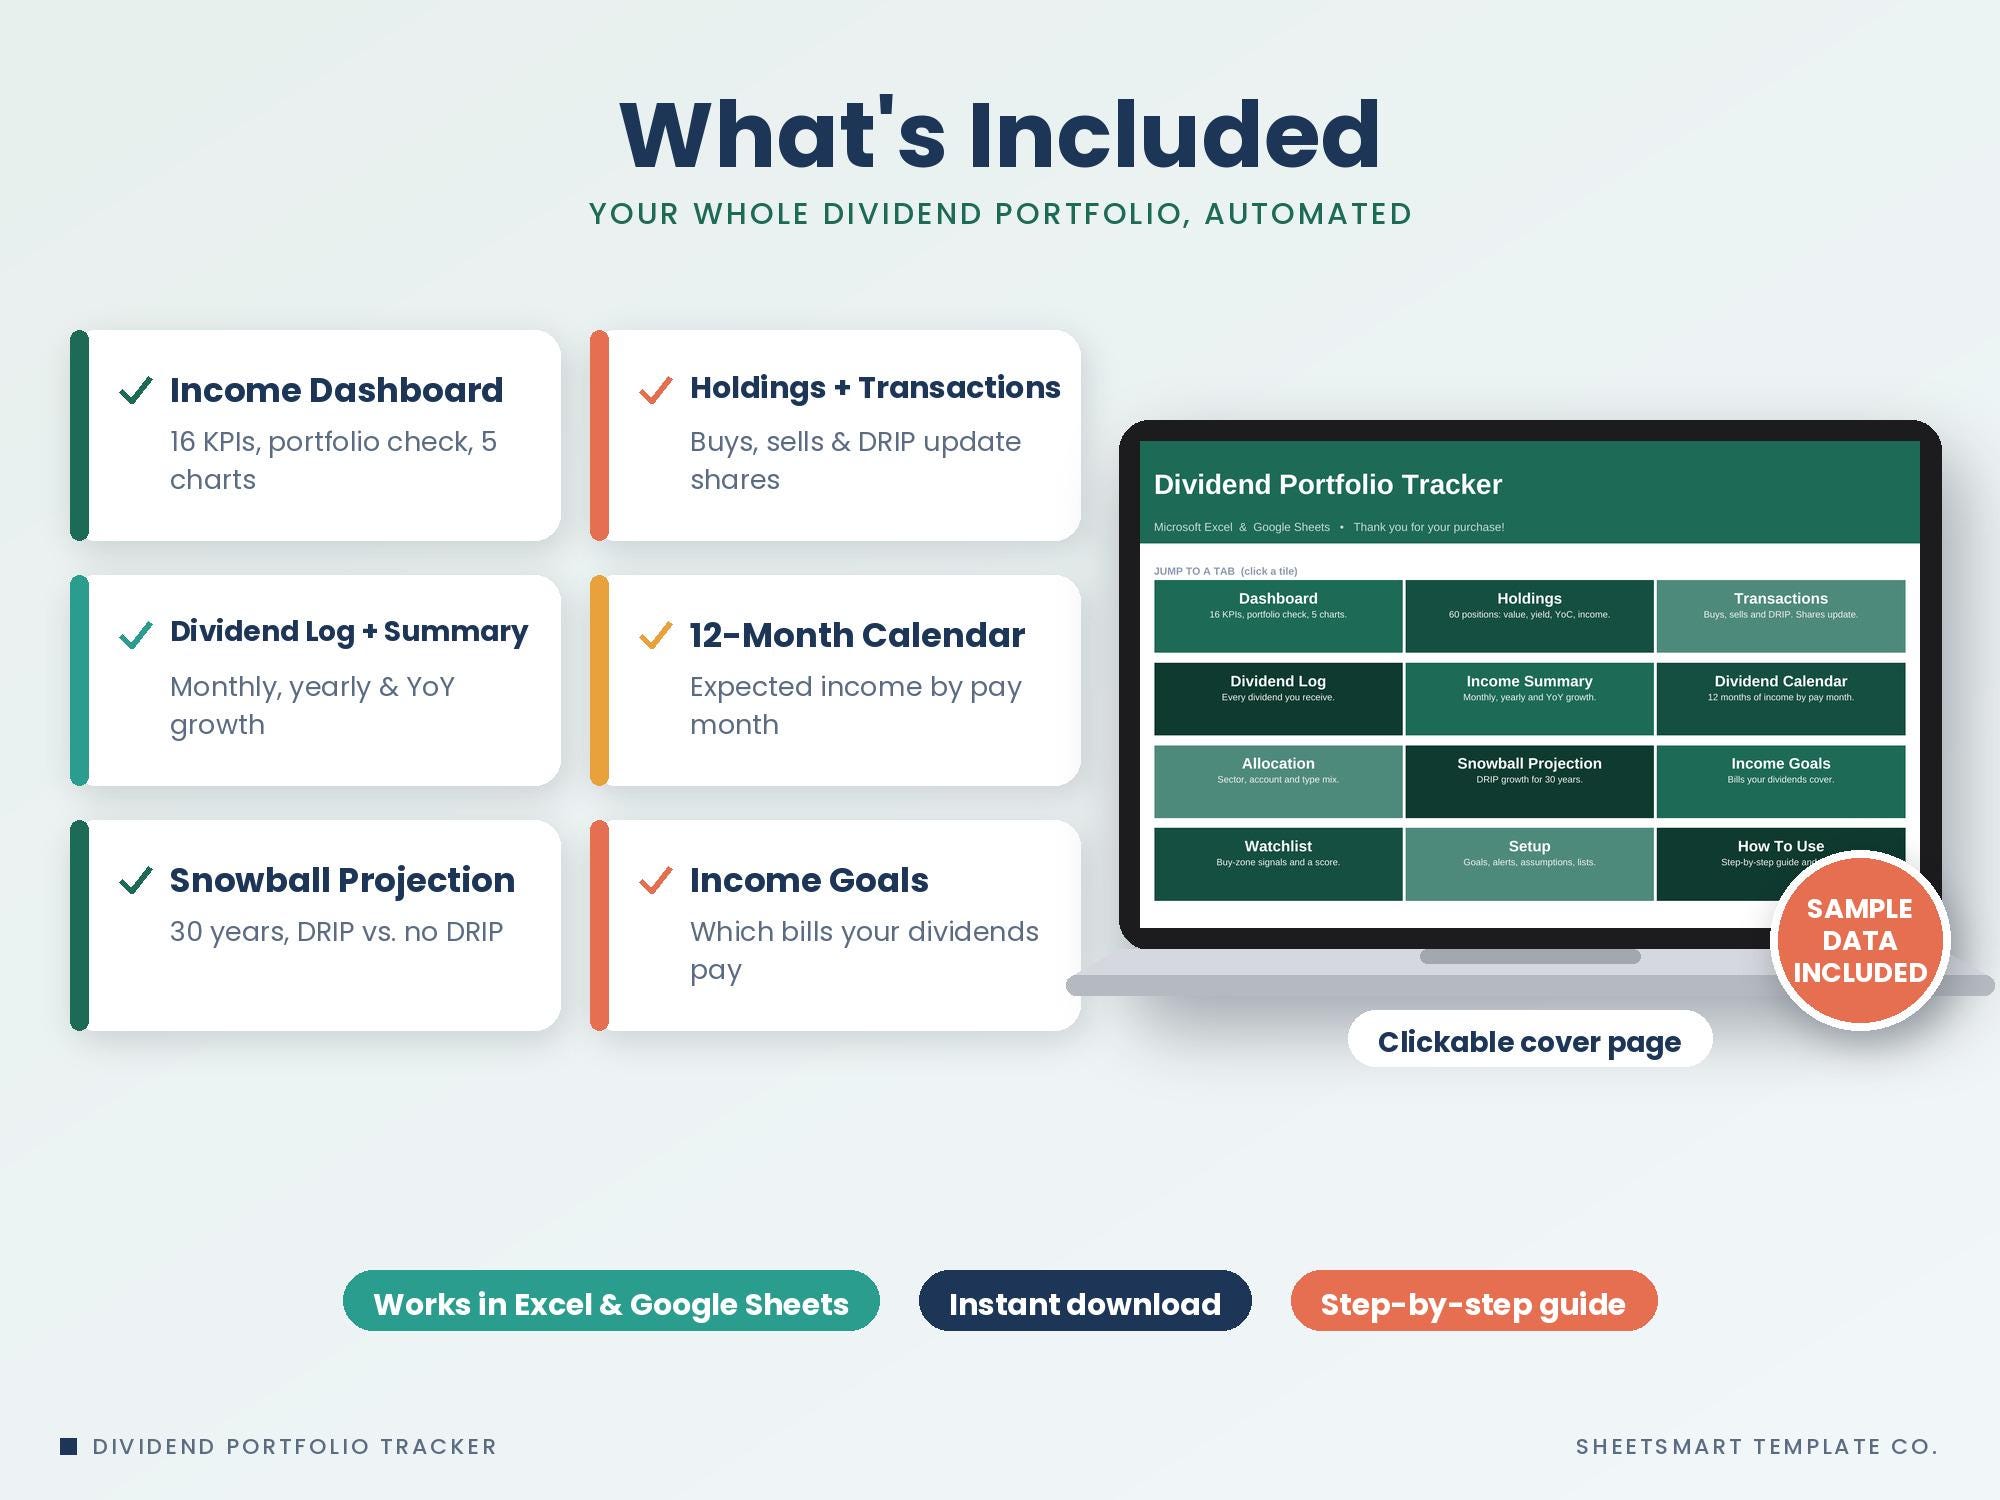
★ WHAT'S INCLUDED ★
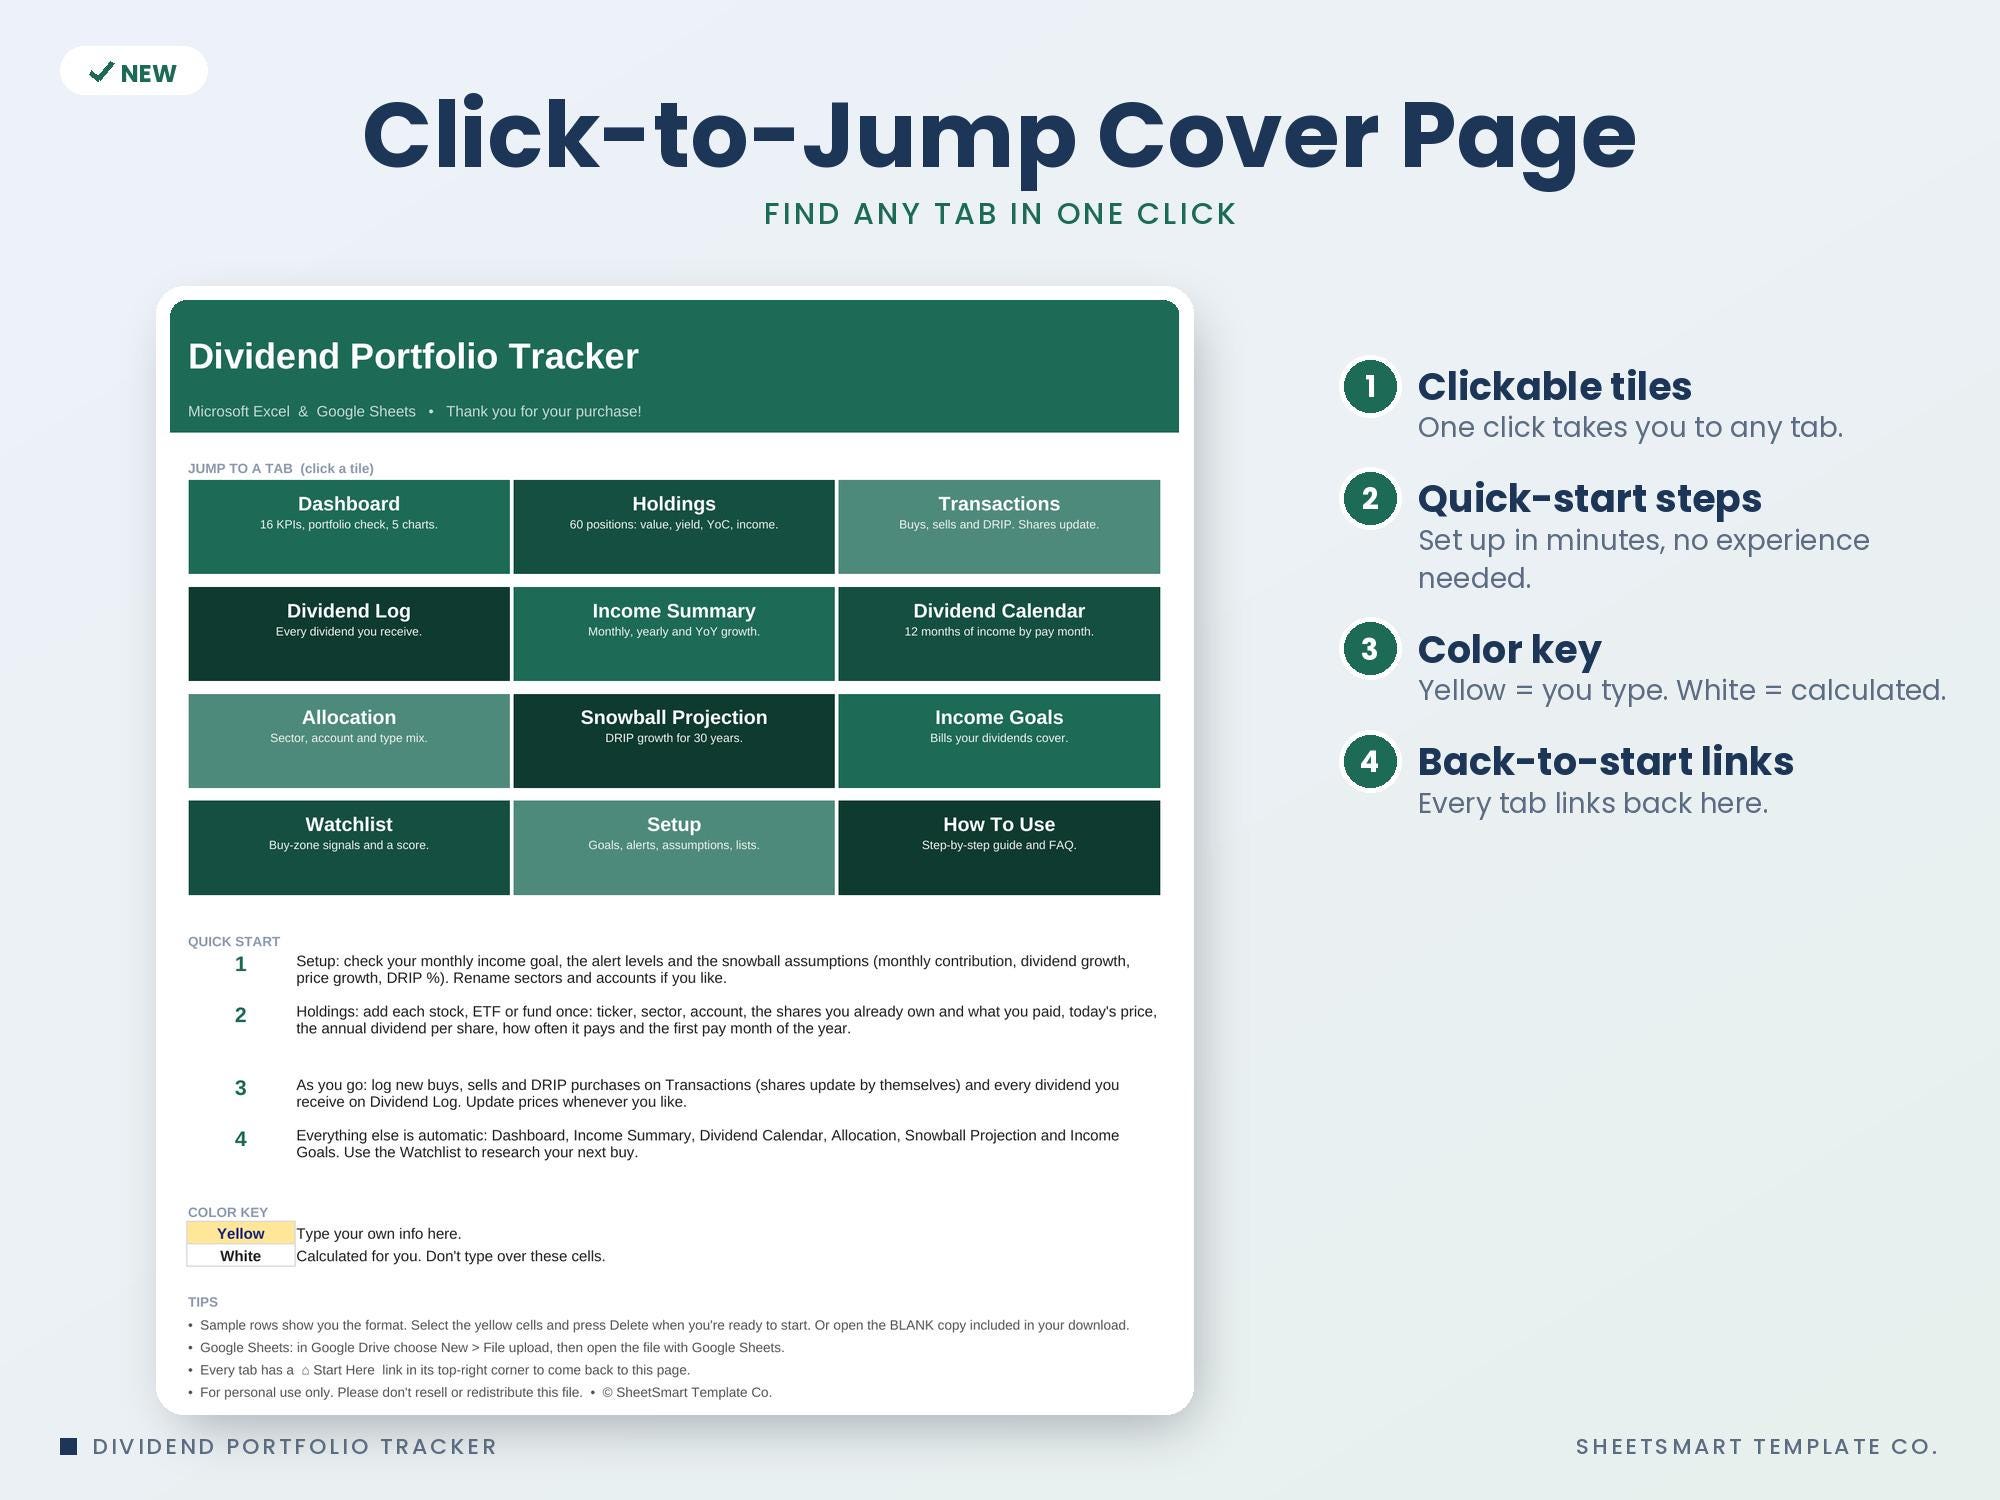
• Clickable Start Here cover page with quick-start steps and a colour key (yellow = you type, white = calculated)
• Dashboard: 16 KPI tiles (portfolio value, cost basis, unrealized gain, forward annual income, monthly income, current yield, yield on cost, income growth, received this year, last 12 months, all-time dividends, next 3 months, income goal progress, bills covered, projected income and realized gains), income by month vs. last year, an 8-point portfolio check, top 10 income payers, upcoming ex-dividend dates and 5 charts
• Holdings: up to 60 stocks, ETFs or funds with sector, type and account drop-downs. Shares, cost basis, average cost, market value, gain/loss, weight, current yield, yield on cost, annual and monthly income, pay months, next pay month and status flags are calculated for you. You type prices yourself (no live feeds, nothing to break)
• Transactions: 500 rows for buys, sells and DRIP reinvestments. Shares owned and average cost basis update automatically and sells show your realized gain
• Dividend Log: 1,000 rows for every payment, with tax withheld, net received and reinvested yes/no
• Income Summary: dividends received by month for 6 years, yearly totals, year-over-year growth, this year vs. last year month by month, plus totals by account and by holding, with 2 charts
• Dividend Calendar: expected income from each holding in each of the 12 months (monthly, quarterly, semi-annual or annual payers), with received this year and last year and a chart
• Allocation: value, income and yield by sector, account and asset type, top 10 positions and concentration limits, with 3 charts
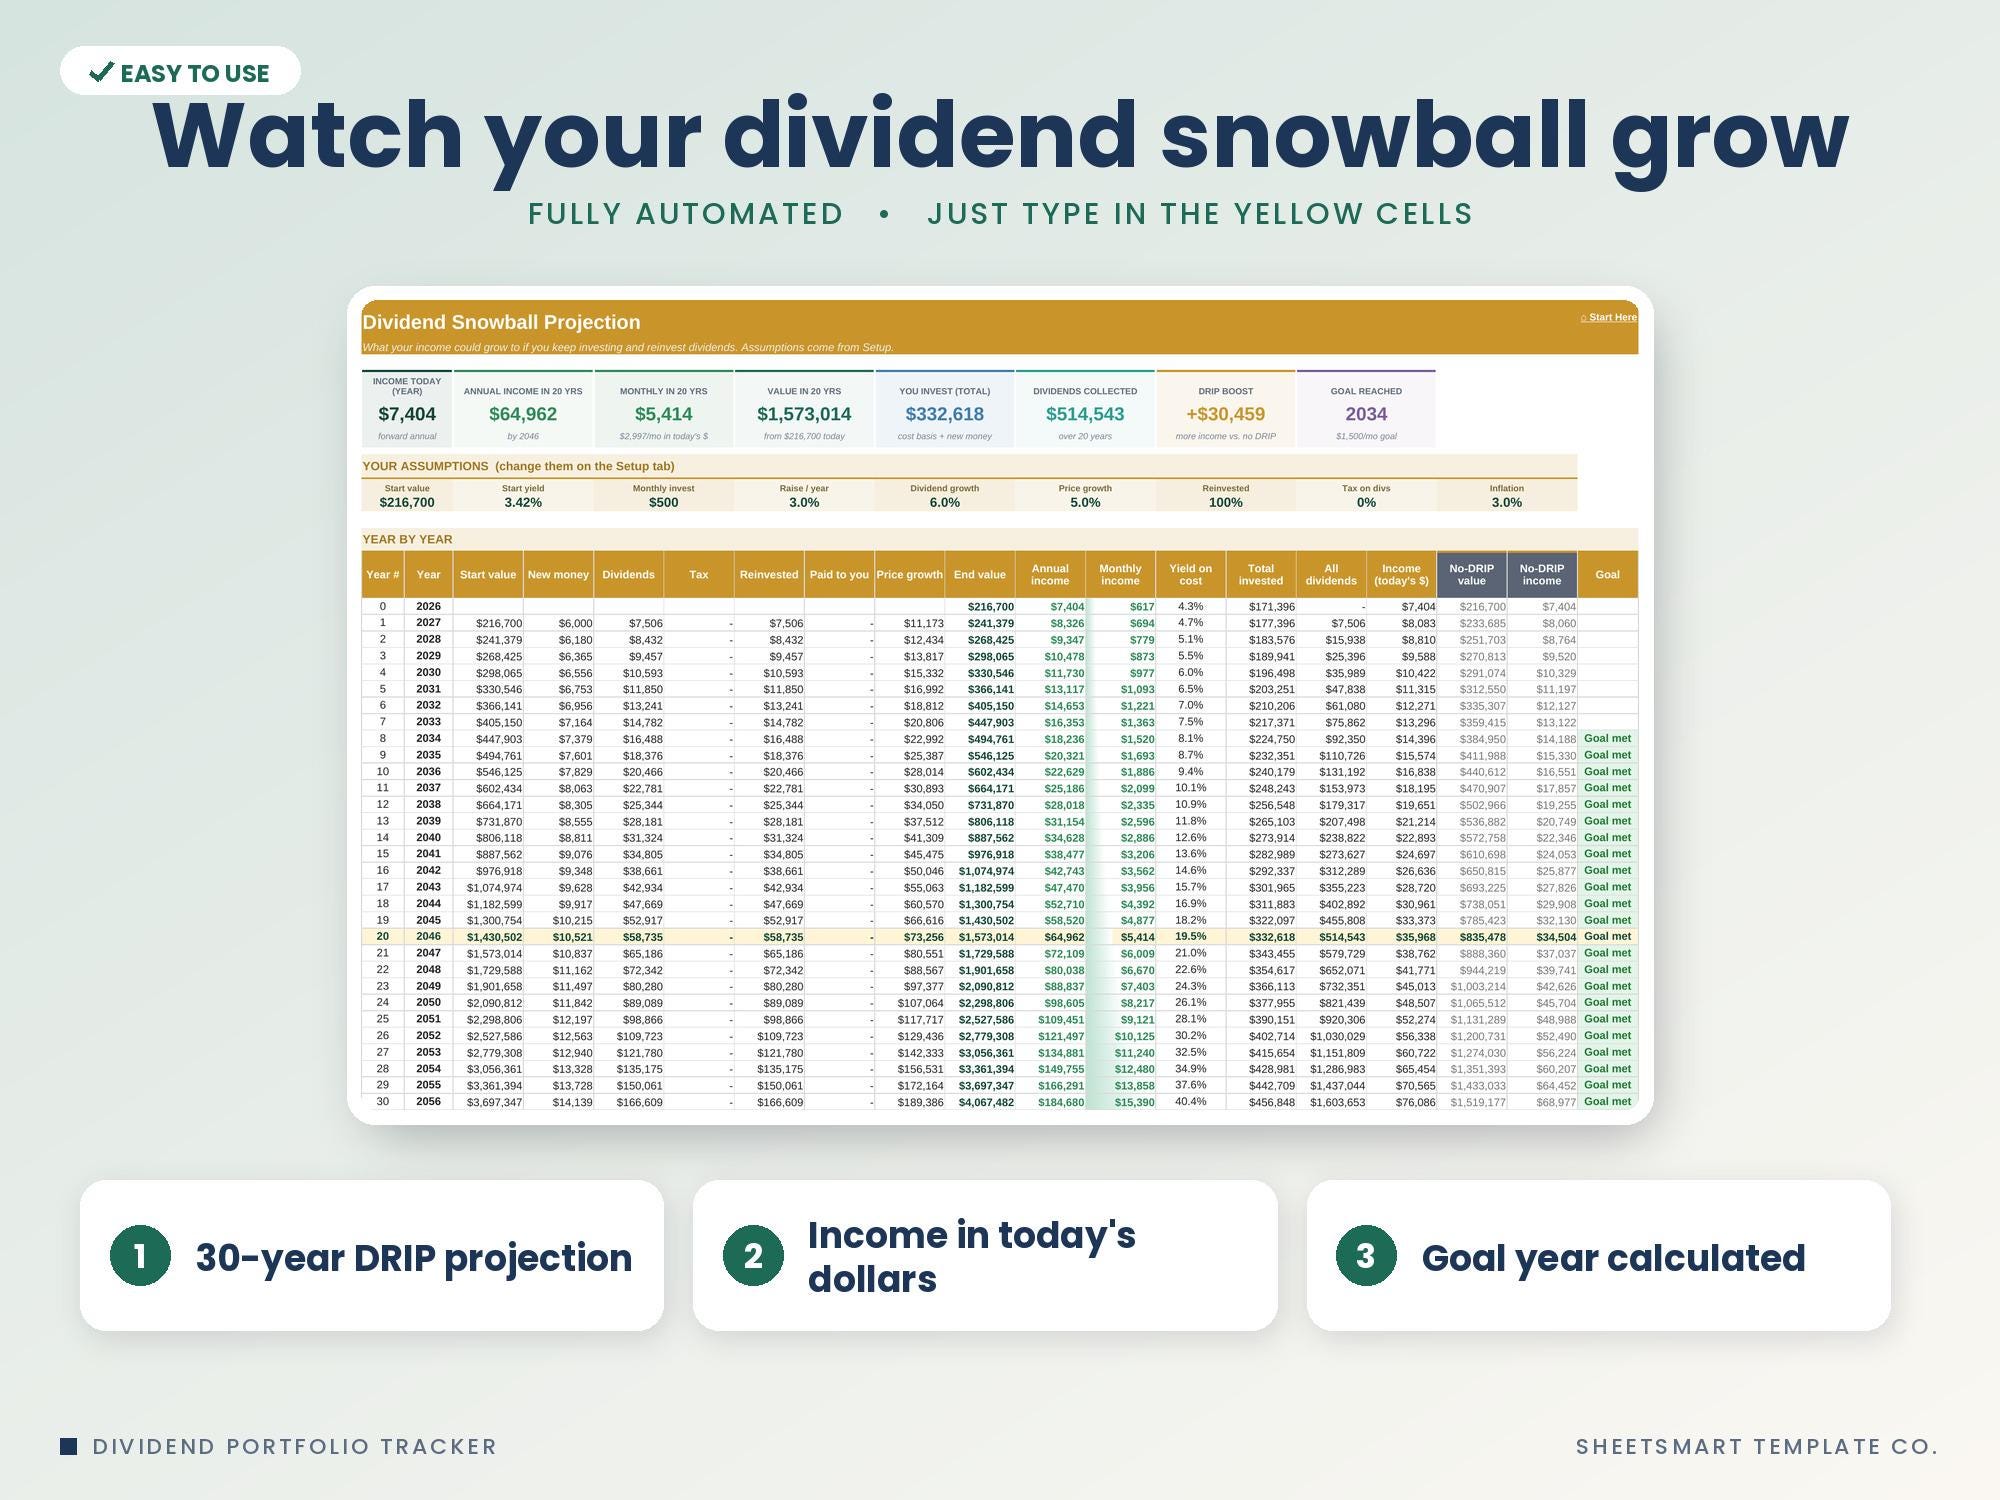
• Snowball Projection: 30 years of DRIP growth from your contribution, dividend growth, price growth and tax assumptions, with vs. without DRIP, income in today's dollars and the year you reach your goal, with 2 charts
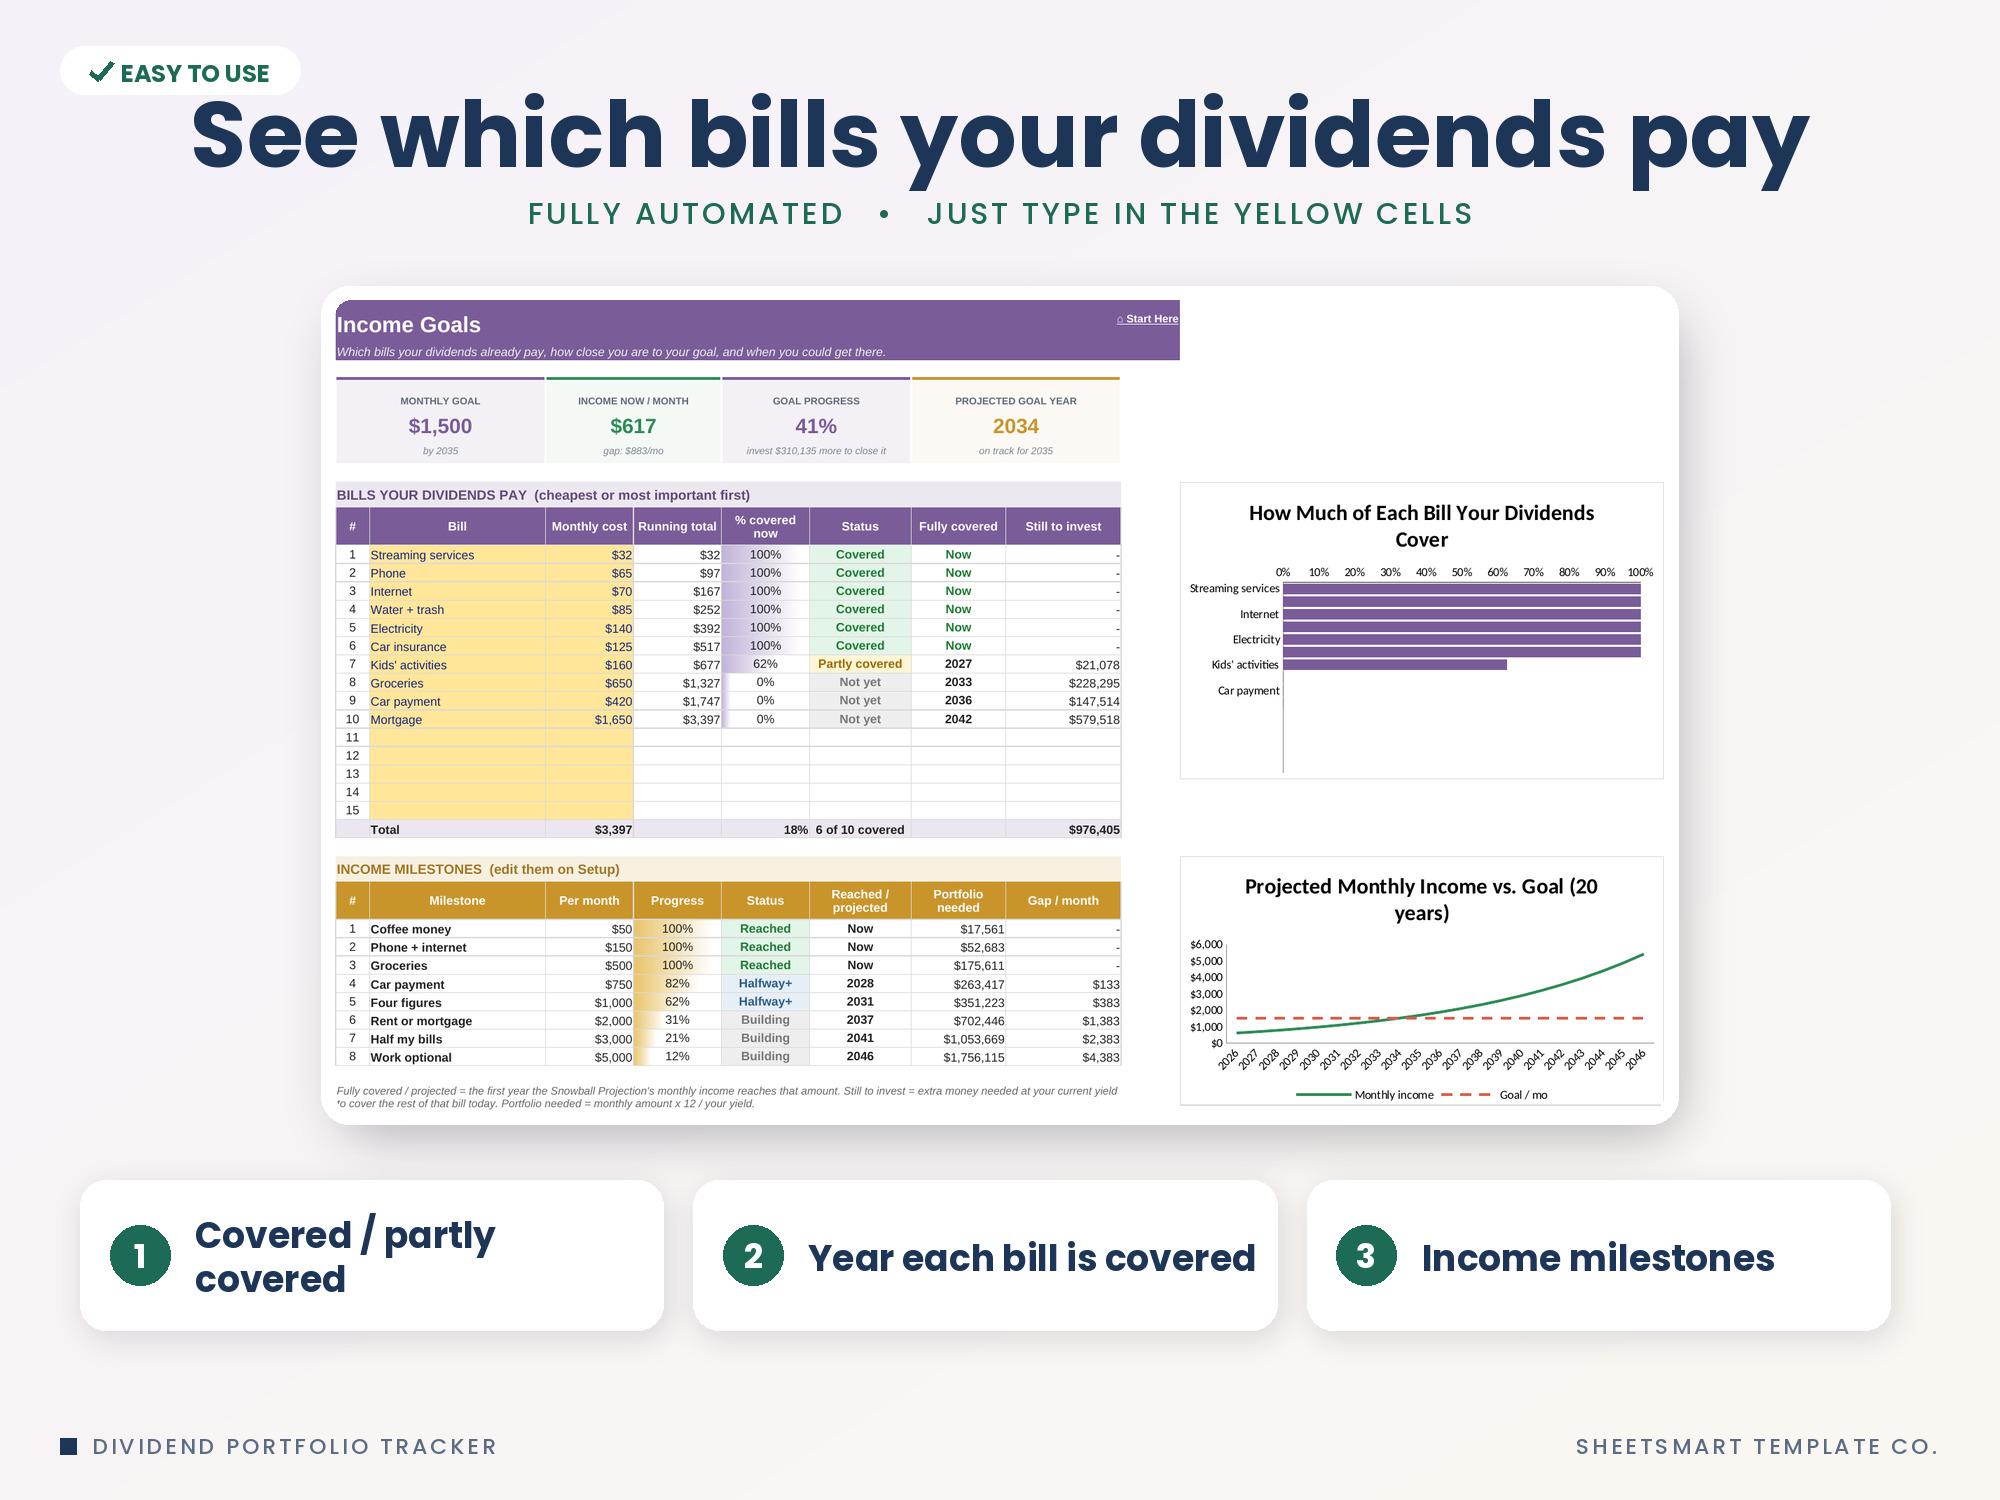
• Income Goals: list your bills and see which ones your dividends already pay, the year each one gets covered, and 8 income milestones, with 2 charts
• Watchlist: 40 rows with yield, yield at your target price, buy-zone signal and a simple 0-5 score based on your own rules
• Setup: income goal, alert levels, snowball assumptions, sectors, accounts, asset types and milestones, all editable
• How To Use guide with FAQ
• 15 charts in total, drop-down menus throughout, and sample data so you can see how everything works
• A sample-data version and a blank ready-to-use version, for both Excel and Google Sheets
★ SAVE WITH A BUNDLE ★
Get this
Free Monthly Budget Starter Kit
5 printable pages: a monthly budget sheet, a 12-month bill checklist and 3 savings-goal trackers. Free when you join the email list.
Get the free kit